To receive a free PDF copy of The Fundamentals of Electrocardiograph Interpretation by Harry Mond, subscribe to his email blog by entering your email address below.
Thank you! Your submission has been received!
Oops! Something went wrong while submitting the form.
Purchase the textbook
Purchase a hard cover or paperback copy of The Fundamentals of Electrocardiograph Interpretation by Harry Mond on Amazon.
In 1970, I commenced work as a “novice” cardiologist at The Royal Melbourne Hospital. Training at that time was learning how to recognise the diastolic murmur of mitral stenosis and making sure the ECG and chest x-rays were the correct way up. As this was prior to coronary artery surgery, stenting and echocardiography, the ECG was a highly respected tool for the diagnosis of many conditions. I was fortunate to befriend a number of the gurus of ECG interpretation who taught me to look into the soul of an ECG. Today, even though the ECG is the first investigation performed by a cardiologist, the art of ECG interpretation has been lost because we depend on the new tools for cardiac diagnosis.
In 1972, I helped arrange a 2-day workshop at the hospital with the two top ECG educators at the time; Leo Schamroth and Barny Marriott. Leo showed an ECG which he had published a few years earlier on a previously unknown disorder. Here is the ECG and this was the quality of almost all ECGs at that time.
What do you think? Answer at end. Write to me if you got it right.
How does one investigate an ECG to release the hidden gems in its soul? Let us analyse what appears to be a simple supraventricular tachyarrhythmia.
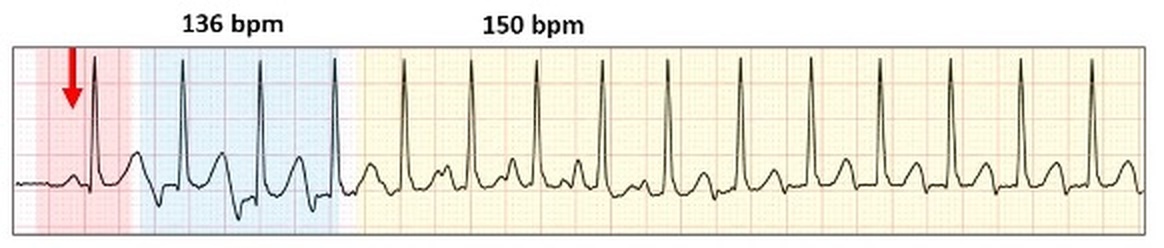
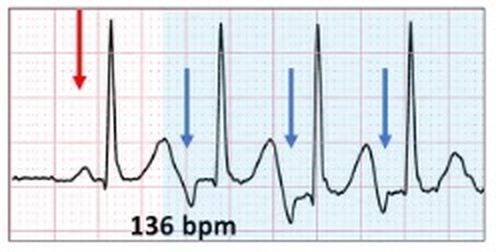
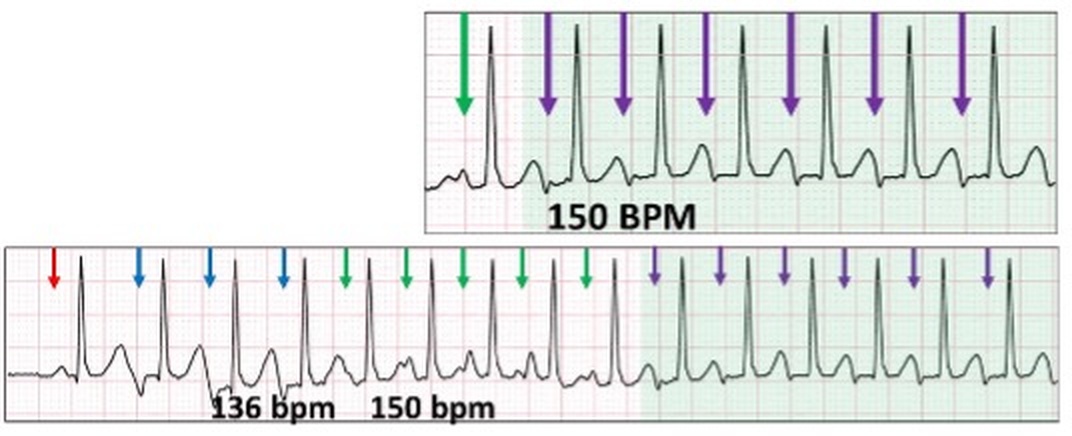
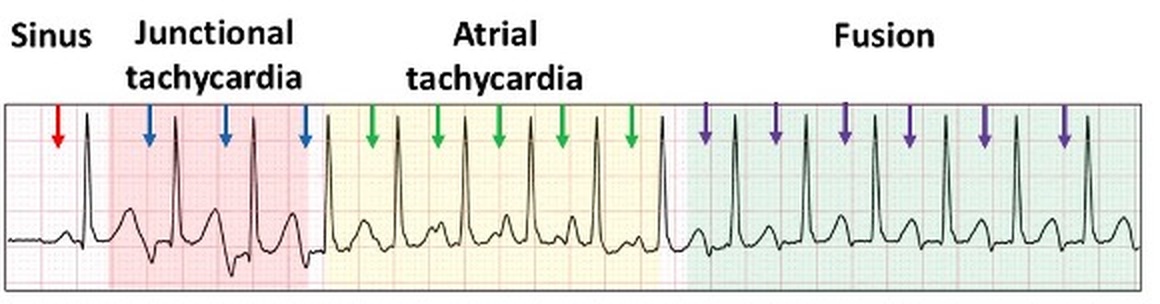
The first complex is sinus generated (red arrow and highlight). The tracing then deteriorates into a narrow complex tachycardia. Most physicians would call this a supraventricular tachycardia and leave it to the EP study to make a diagnosis. We need to look further.
There are two different tachycardia rates with different P wave configurations.
Let us review the first one (blue highlight).
Inverted P waves (blue arrows). This is most likely a junctional tachycardia.
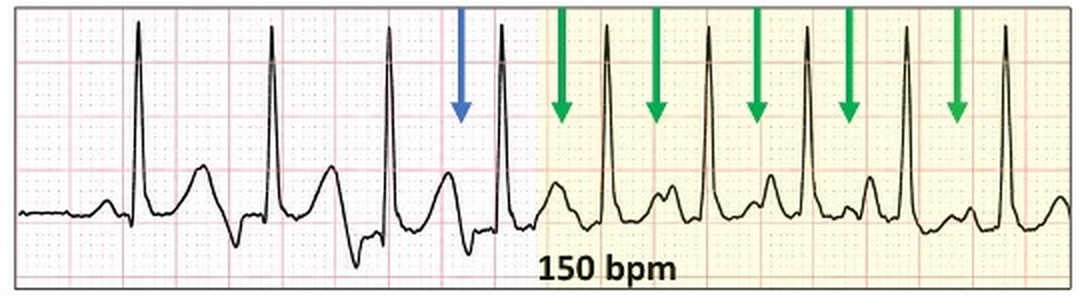
What about the second (yellow highlight)?
Transition to a tachycardia with P waves similar to the sinus P waves (green arrows). At 150 bpm, this is most likely an atrial tachycardia but also think atrial flutter.
We have two supraventricular tachyarrhythmias competing with each other for ventricular depolarization. What happens when the rates approximate each other?
Once again, the P waves are inverted but smaller than earlier (green highlight). Both supraventricular ectopic foci depolarize the atria as fusion beats although probably only the junctional focus depolarizes the ventricle.
In summary:
This ECG highlights a poorly recognised and understood feature of junctional rhythm. If with junctional tachycardia, there is no retrograde conduction, then the atrium continues to depolarize separately. This can be sinus rhythm, an atrial tachyarrhythmia and even atrial fibrillation. However, with retrograde conduction, there is now competition between the supra-nodal and junctional foci as seen with our case study which resulted in fusion beats.
If you got it correct, please write to me.
What about the Schamroth ECG?
Firstly, wave the magic wand of AI.
This is the first description of sino-atrial Wenckebach block. Note the two dropped P waves (ghosted red arrows).
As its name implies, AVNRT is a reentrant junctional or supraventricular tachyarrhythmia which involves the fast and slow pathways within the AV node creating a self-perpetuating circus movement. It can be divided into typical (slow-fast) or atypical (fast-slow) as well as several rarer forms related to more than one slow or fast pathway with similar electrophysiological properties. On the ECG, they can be identified and differentiated by the positioning of the P wave in relation to the QRS complex, which in turn is related to the direction of the re-entrant AV nodal circuit. However, in about 60% of cases, the P wave is buried in the QRS/T and cannot be identified on the surface ECG.
Retrograde conduction is defined as conduction from an ectopic site to the atrium via the AV node or accessory pathway and referred to as VA conduction. II results in a P wave configuration which differs from an anterograde P wave, and in most ECG leads is inverted. The site from where the impulse originates can be the AV node, Bundle of His, distal conducting system or the body of the ventricles including ventricular pacing. On the ECG, the QRS complex usually precedes the inverted retrograde P wave but on occasion may follow it.
In 1970, I commenced work as a “novice” cardiologist at The Royal Melbourne Hospital. Training at that time was learning how to recognise the diastolic murmur of mitral stenosis and making sure the ECG and chest x-rays were the correct way up. As this was prior to coronary artery surgery, stenting and echocardiography, the ECG was a highly respected tool for the diagnosis of many conditions. I was fortunate to befriend a number of the gurus of ECG interpretation who taught me to look into the soul of an ECG. Today, even though the ECG is the first investigation performed by a cardiologist, the art of ECG interpretation has been lost because we depend on the new tools for cardiac diagnosis.