To receive a free PDF copy of The Fundamentals of Electrocardiograph Interpretation by Harry Mond, subscribe to his email blog by entering your email address below.
Thank you! Your submission has been received!
Oops! Something went wrong while submitting the form.
Purchase the textbook
Purchase a hard cover or paperback copy of The Fundamentals of Electrocardiograph Interpretation by Harry Mond on Amazon.
Some years back, I was asked to interpret this ECG, during rounds in the coronary care unit.
The patient had been admitted the night before with high degree atrio-ventricular block and required temporary pacing.
Before reading further try and interpret the findings.
Clue: There is regular pacing.
Don’t cheat. Have another look.
OK, we will look at each part of the tracing together!
The red highlighted area shows a stimulus artefact (SA) followed by a P wave and AV conduction. The QRS has a right bundle branch block.
Atrial pacing with conduction
The P wave axis is unusual foratrial pacing.
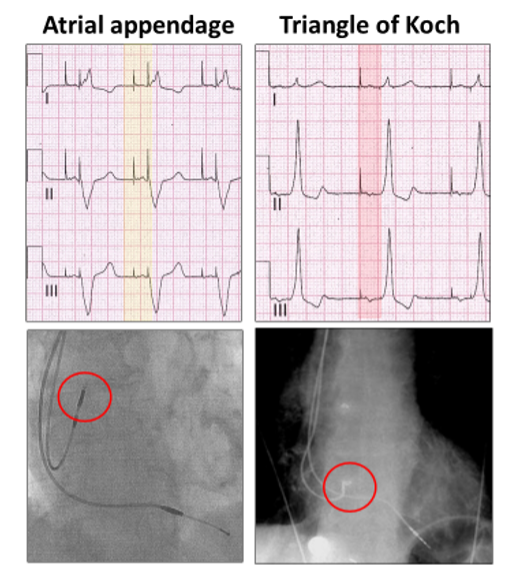
It is left axis deviation, unlike atrial pacing from the atrial appendage.
High atrial pacing has a normal P wave axis (yellow highlight), whereas with pacing from the triangle of Koch at the mouth of the coronary sinus, the wave of depolarization is toward the left shoulder and P waves inverted in leads II and III (red highlight).
Atrial pacing is very low in the atrium.
However, not all atrial paced beats are conducted (red highlight), because of the intermittent AV block:
Atrial pacing with failed conduction
There appears to be ventricular paced beats as well (yellow highlight).
Left ventricular pacing near apex
I checked the groin and there was only one temporary pacing lead!
The QRS axis is markedly left with aright bundle branch block.
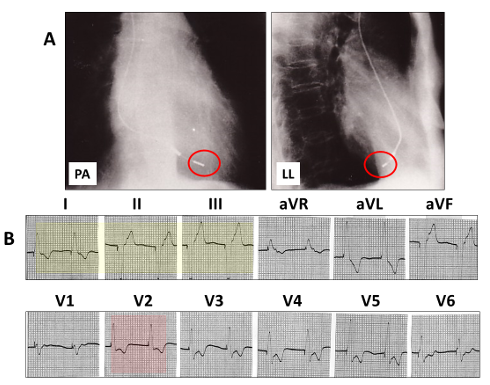
This is left ventricular pacing from an area very low, near the apex of the heart.
It is identical to a lead in the middle cardiac vein:
A: The cardiac silhouette with a lead tip (red open rings), close to the apex in the postero-anterior (PA) view and passing posterior in the left lateral (LL).
B: the pacing QRS is left axis deviation (yellow highlight) and right bundle branch block (red highlight).
But there is something else you allmissed!
Atrial and ventricular pacing
There is a paced P wave embedded within and at the commencement of the paced QRS and only one stimulus artefact.The temporary lead is pacing both atria and ventricles.
Let us summarize:
There is:
Continual right and/or left atrial capture with and without AV conduction (red highlight)
Intermittent left ventricular capture (yellow highlight)
The pacing lead lies within the mouth of the coronary sinus and can pace both atria and ventricles, although there is intermittent ventricular exit block.
You don’t need a chest X-ray as you know the answer!!