To receive a free PDF copy of The Fundamentals of Electrocardiograph Interpretation by Harry Mond, subscribe to his email blog by entering your email address below.
Thank you! Your submission has been received!
Oops! Something went wrong while submitting the form.
Purchase the textbook
Purchase a hard cover or paperback copy of The Fundamentals of Electrocardiograph Interpretation by Harry Mond on Amazon.
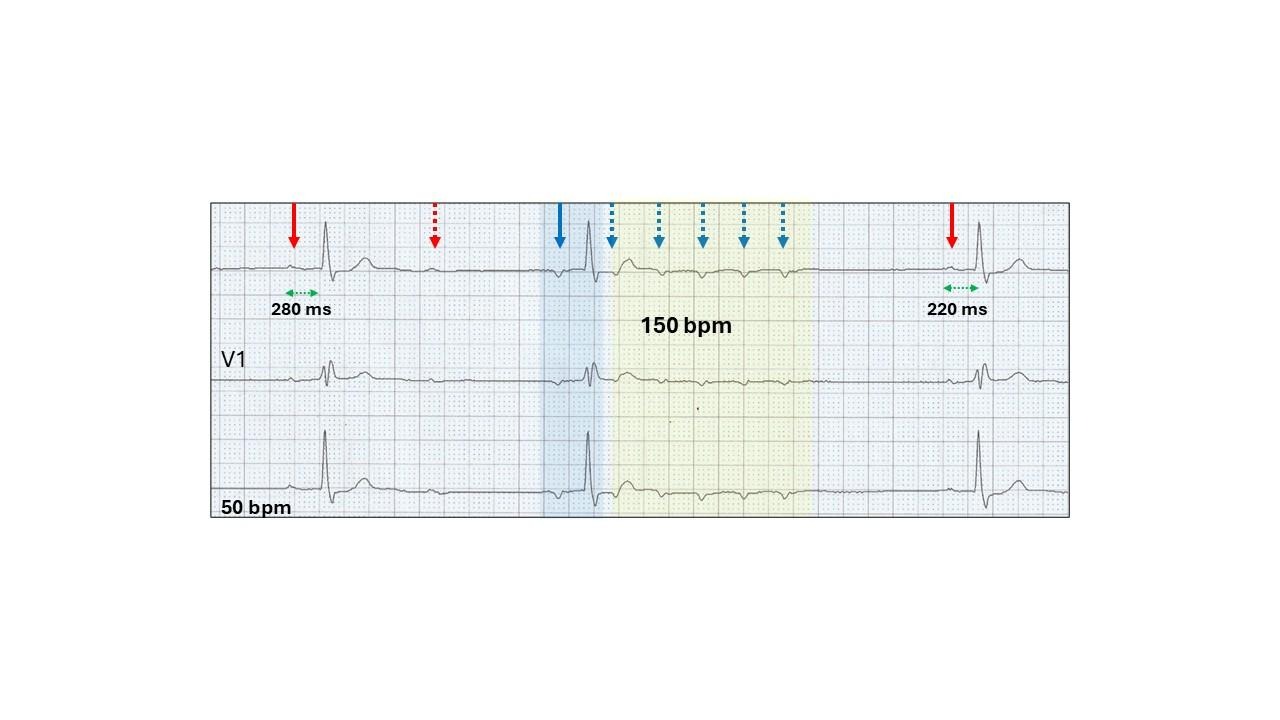
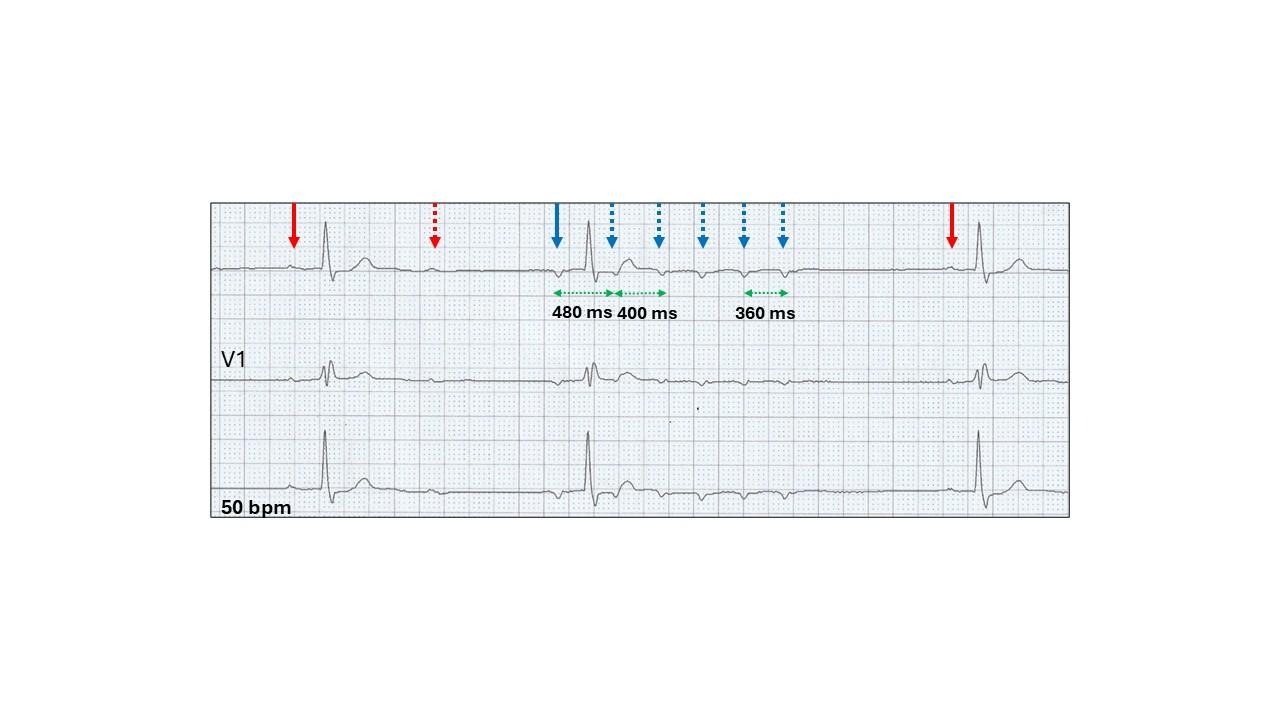
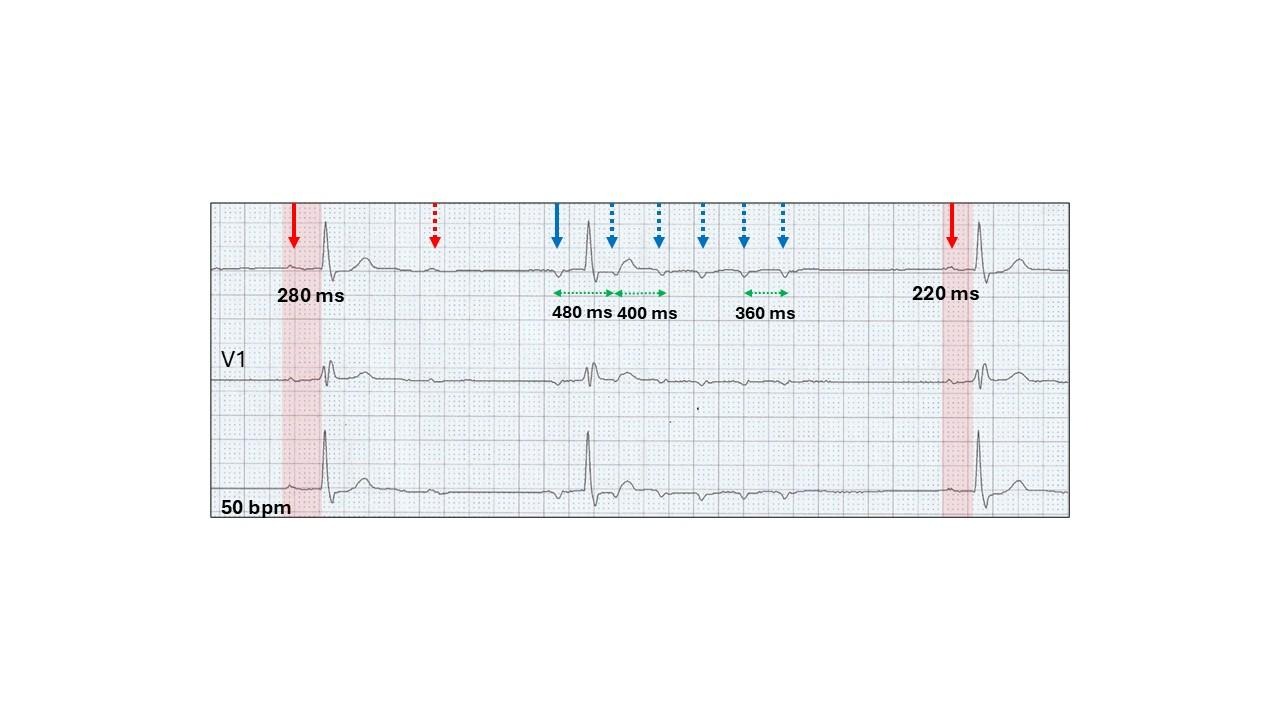
Wenckebach AV block with the absolute criteria fulfilled. The longest PR interval is before the dropped beat (280 ms), a dropped beat (red stippled arrow) and the shortest PR interval (220 ms) after the dropped beat.
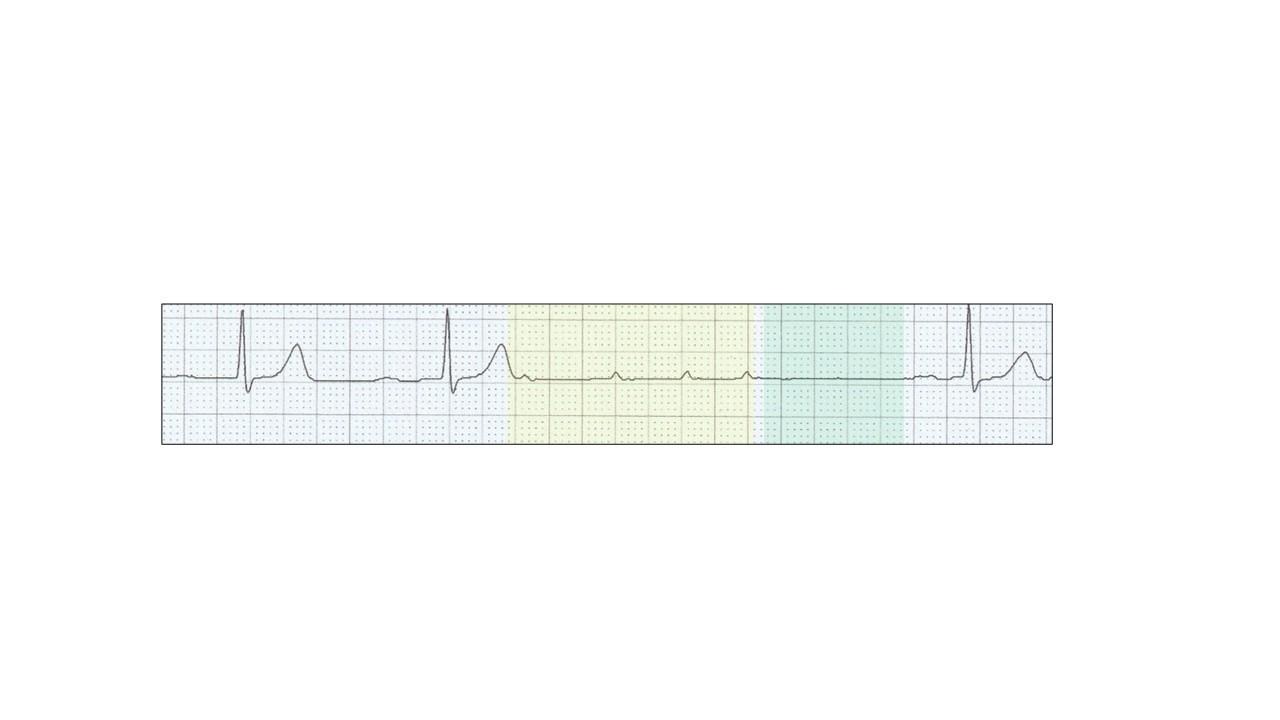
Conducted escape atrial ectopic (blue highlight, blue arrow).
Run of non-conducted atrial tachycardia (yellow highlight, blue stippled arrows).
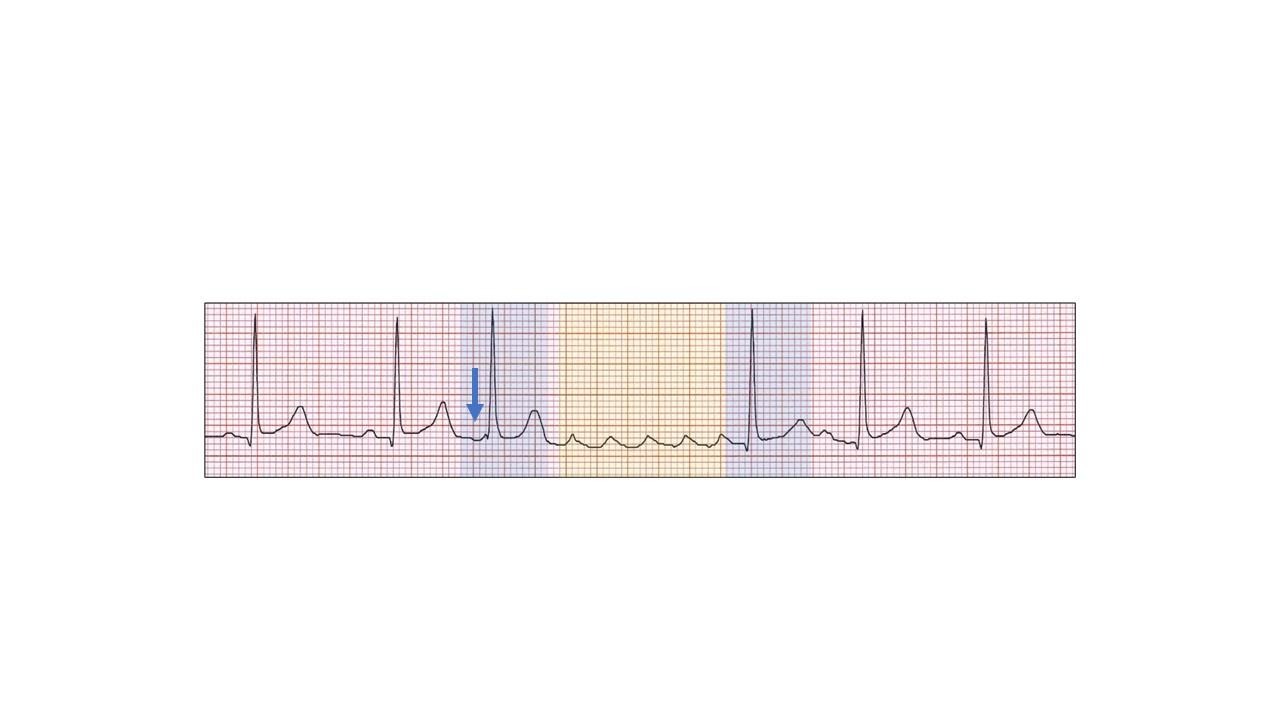
Wenckebach AV block and non-conducted focal atrial tachycardia.
Let us review non-conducted focal atrial tachycardia.
Non-conducted focal atrial tachycardia are short runs of atrial tachycardia with no or limited AV conduction and rarely seen with the resting 12-lead ECG, but not uncommon on Holter monitoring. Because of its consistent appearance, it is easy to diagnose.
Features include:
Underlying sinus rhythm (red highlight).
First beat (an atrial ectopic) may conduct to the ventricle with a long AV delay (blue highlight).
A short run of a rapid non-conducted focal atrial tachyarrhythmia (yellow highlight).
Discrete prominent P waves (blue stippled arrows)
The underlying mechanism is probably enhanced automaticity (spontaneous phase 4 depolarization), although micro-reentry circuits may also be involved.
Pause after the termination of the tachyarrhythmia (green highlight).
The rate and number of ectopic P waves, the positioning in the sequence of the conducted beat or beats, if present, and the length of the terminal pause varies.
Here are examples:
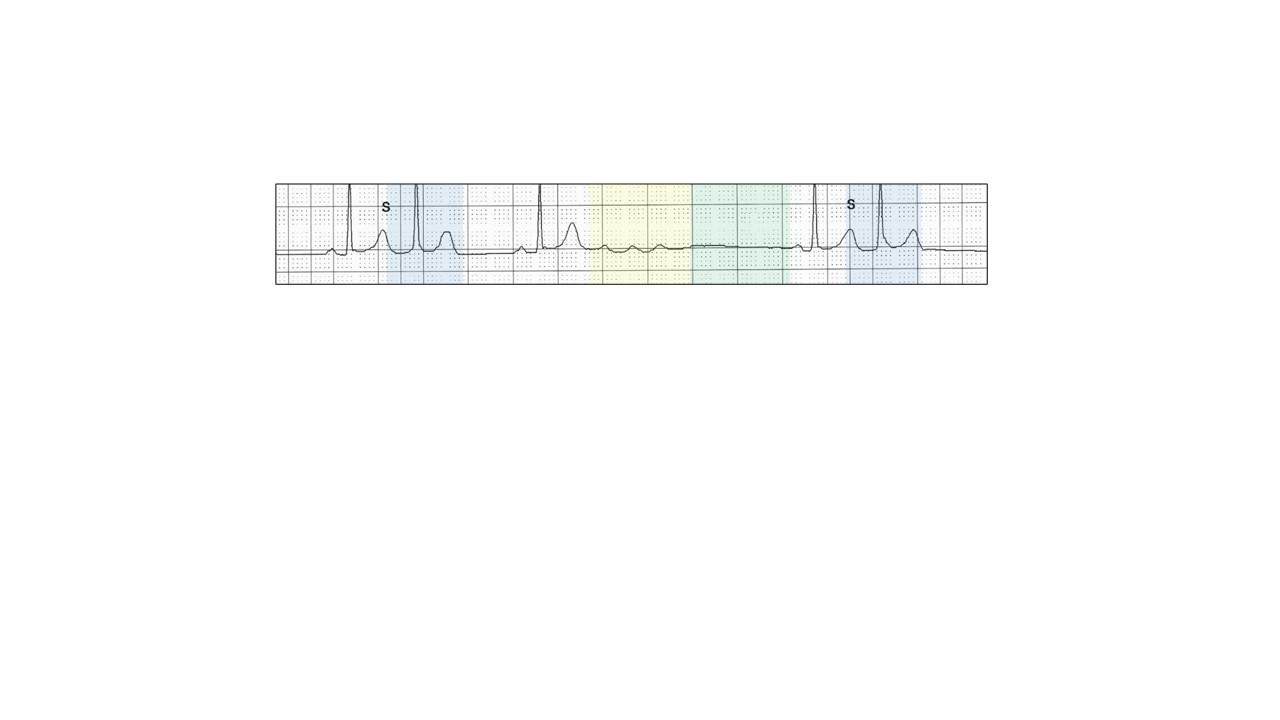
Atrial ectopics (blue highlight, “S”) may be completely separate from the non-conducted run (yellow highlight) and pause (green highlight).
No atrial ectopic.
There is a left atrial abnormality and marked first degree AV block.
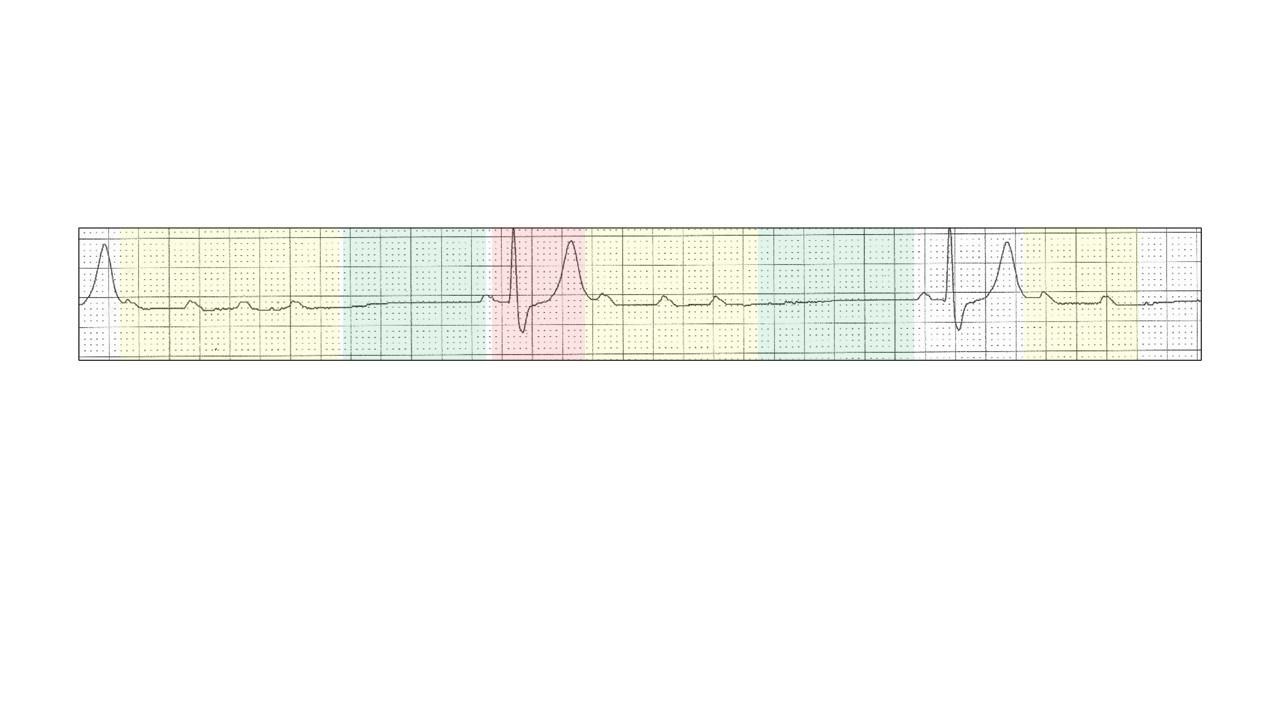
Runs (yellow highlight) and pauses (green highlight) may occur in sequences separated by a single sinus beat (red highlight).
There may be more than one conducted ectopic beat (blue highlight),
Run of both focal conducted and non-conducted atrial tachycardia.
giving rise to complex rhythms.
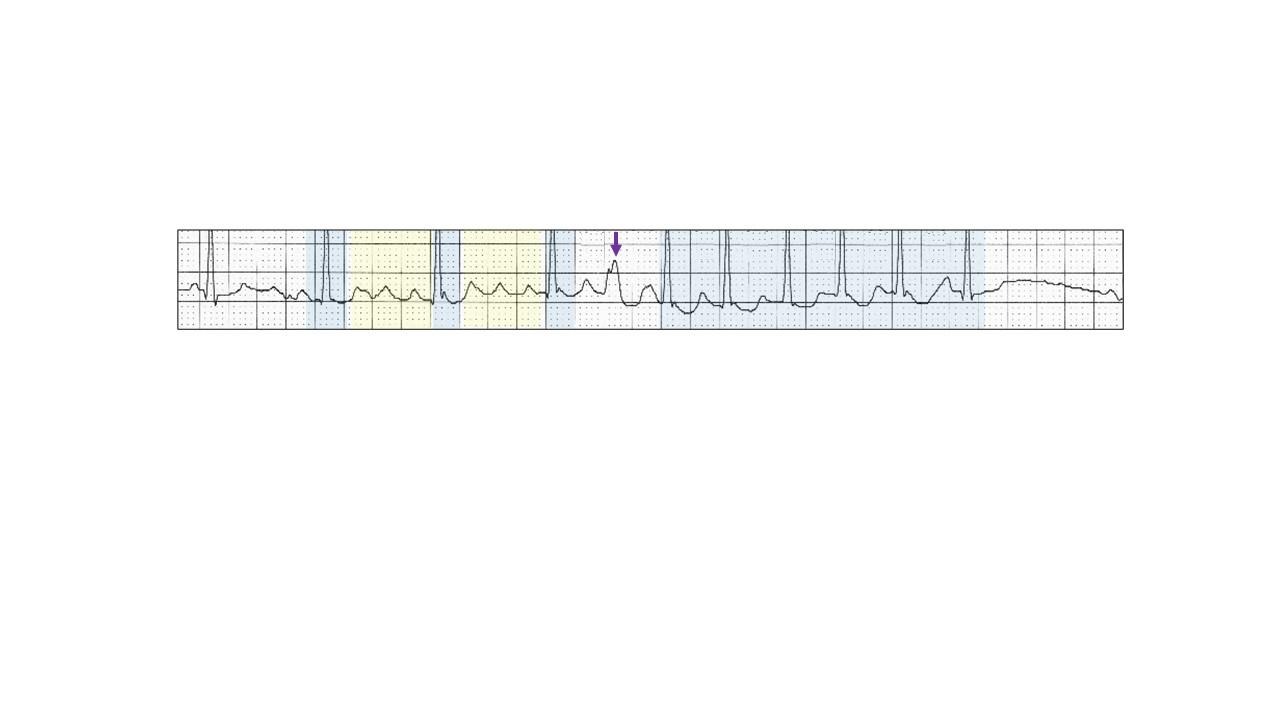
Run of focal atrial tachycardia (yellow highlight) with varying conduction (blue highlight). There is a ventricular ectopic (purple arrow).
No pause.
The conducted ectopic beats may be junctional or from a different atrial site (blue arrow).
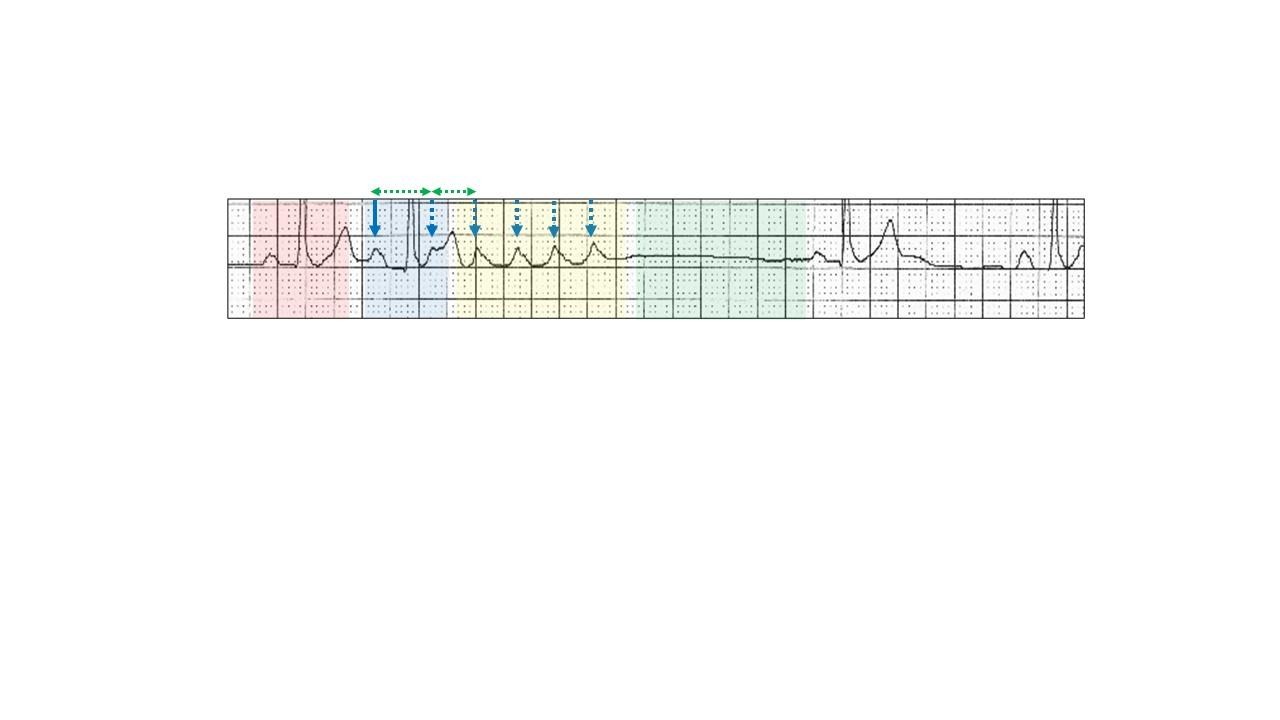
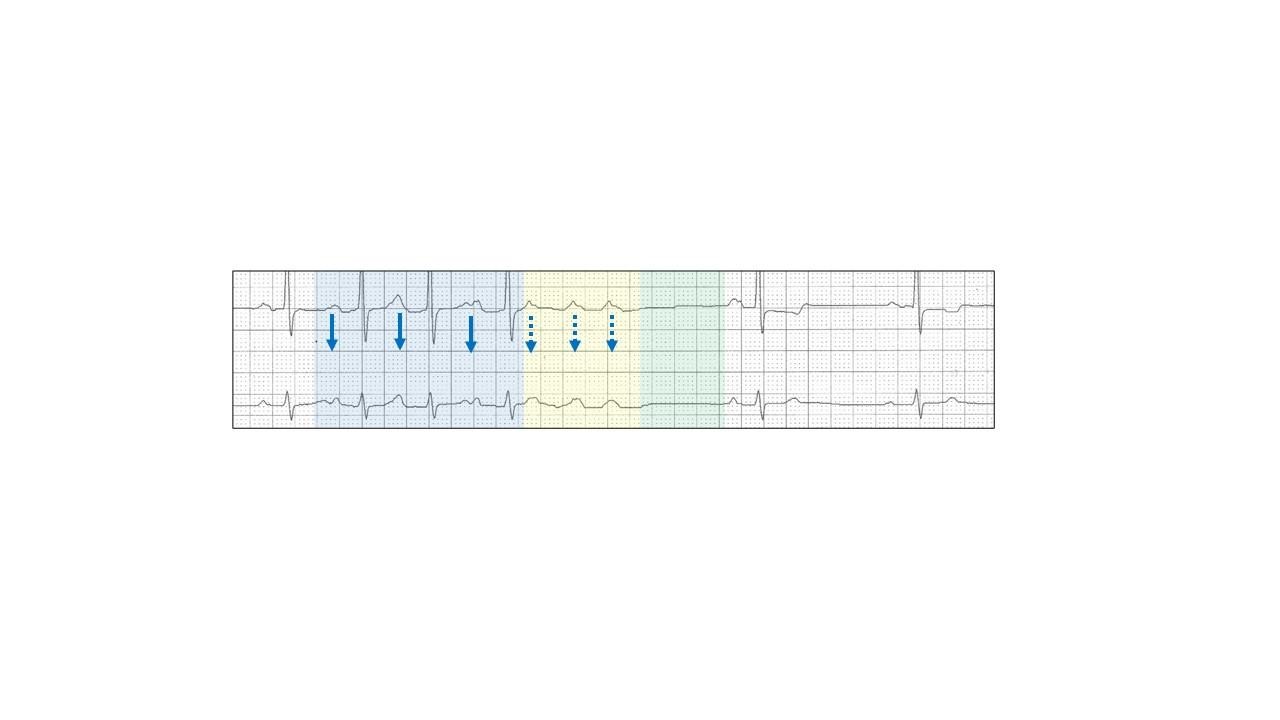
A poorly understood feature non-conducted focal atrial tachycardia is the shortening of the focal tachycardia P-P intervals.
There is an increase in the non-conducted P wave rate with the largest increment reduction between the first and second P waves (green stippled arrows).
Reduction in the P-P interval continues until the tachycardia terminates.
This is called Wenckebach response at the ectopic-atrial interface.
How does the non-conducting focal atrial tachycardia demonstrate a Wenckebach response?
The tachycardia has a focal ectopic origin in the atrium and the Wenckebach block is between the focus and the surrounding atrial tissue as well as block at the AV junction. The greatest increment of the block is between the first and second ectopics with shorter reduction in P-P intervals with successive depolarizations at the interface. This Wenckebach block is supra-AV nodal and therefore, as with sino-atrial Wenckebach, the P-P interval will shorten between successive P waves.
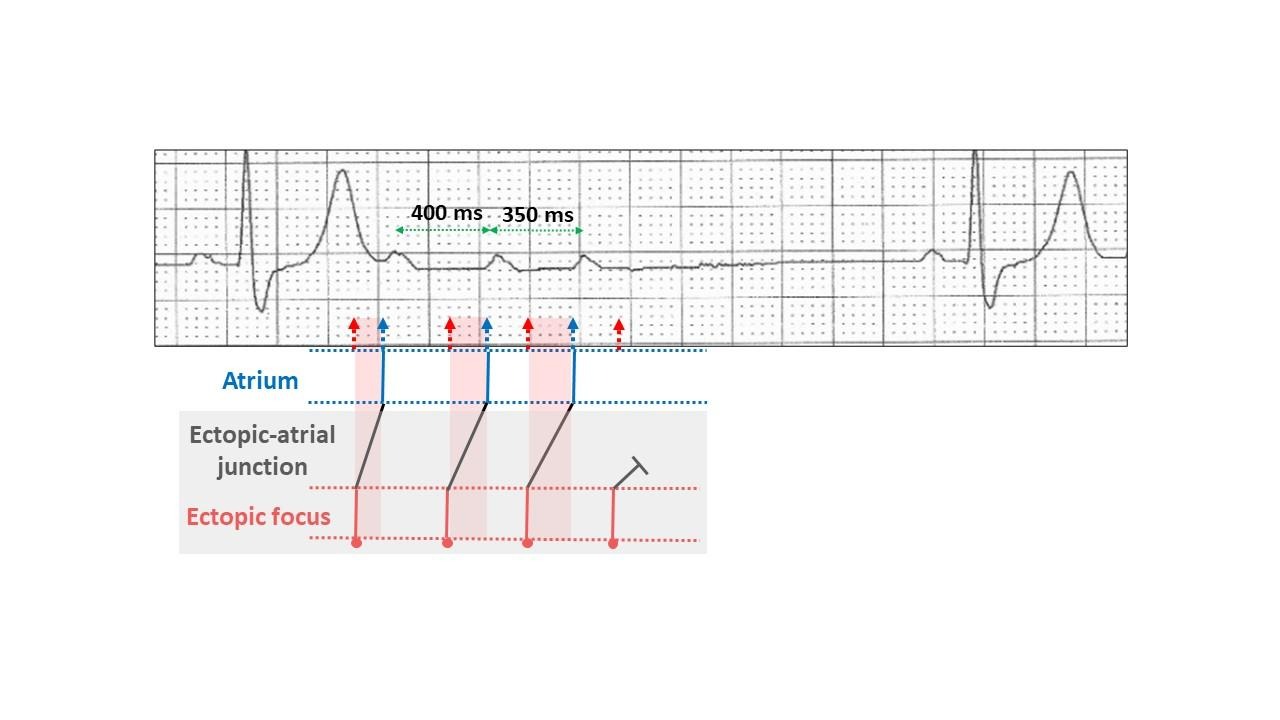
This can be best seen with a short run.
The ectopic focus depolarization (red) is regular.
At the ectopic-atrial interface or junction (black), the Wenckebach response occurs, and it takes increasingly longer for the impulse to commence depolarization of the atrium (red highlight) so that the time from the ectopic focus to the atrium lengthens.
This is at cellular level and concealed (grey highlight). What is seen on the ECG is shortening of the P-P intervals from 400 ms to 350 ms because the increment in delay shortens with each beat and hence what we see is a shortening of the P-P interval.
Remember:
The first ectopic P-P interval in the sequence is always longer than the last (green stippled arrows).
The unique feature with our ECG is the finding of of both complete AV block during the focal non-conducted atrial tachycardia as well as the absolute features of Wenckebach AV block (red highlight) at the AV junction with sinus rhythm.
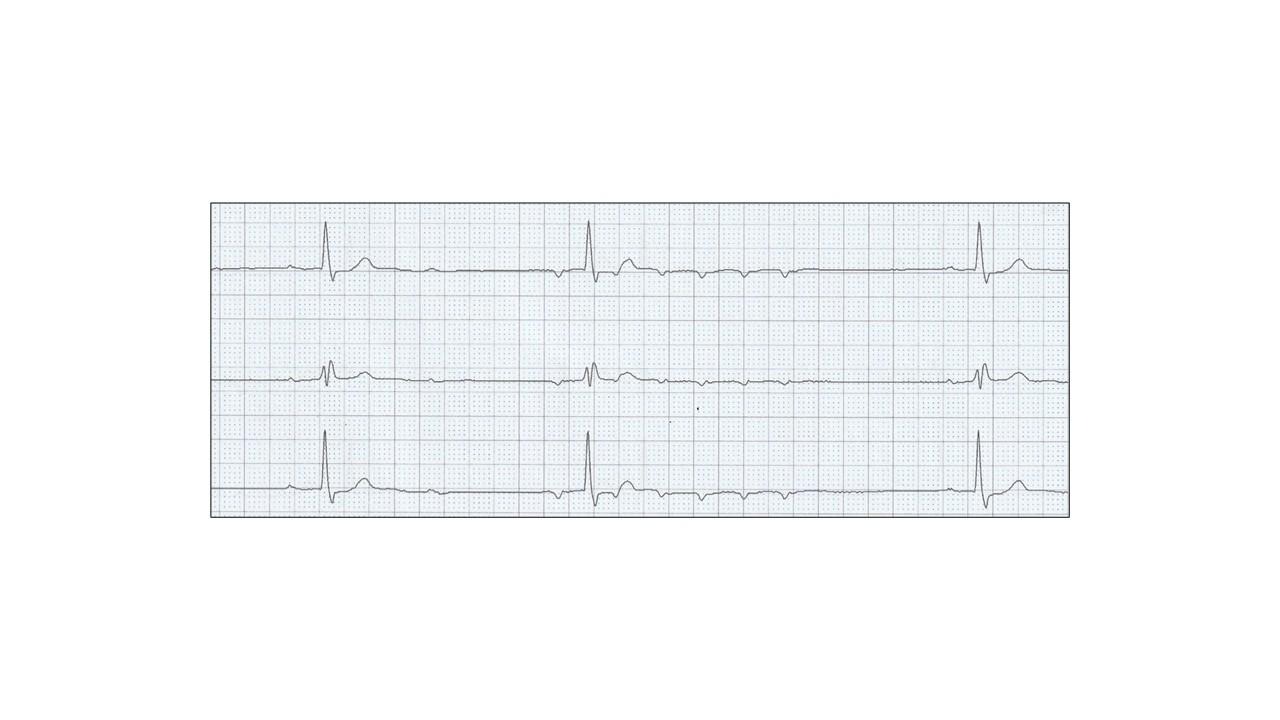
And to think all we had were three identical QRS complexes!
No tricks. Just a selection of tracings from a Holter study.Look at each one carefully, use calipers, arrows and highlight and write down your conclusions.