To receive a free PDF copy of The Fundamentals of Electrocardiograph Interpretation by Harry Mond, subscribe to his email blog by entering your email address below.
Thank you! Your submission has been received!
Oops! Something went wrong while submitting the form.
Purchase the textbook
Purchase a hard cover or paperback copy of The Fundamentals of Electrocardiograph Interpretation by Harry Mond on Amazon.
On Holter monitoring, there is no accurate way to tell where the ectopic focus lies. It can be anyehere in the left or right atria or within the AV junction which anatomically lies between the atria and ventricles but for conduction reasons lies within the atria.
An inverted P wave preceding the QRS may lie within the atria or high in the AV node and a predicted method of differentiating the two ectopic sites is to measure the PR interval.
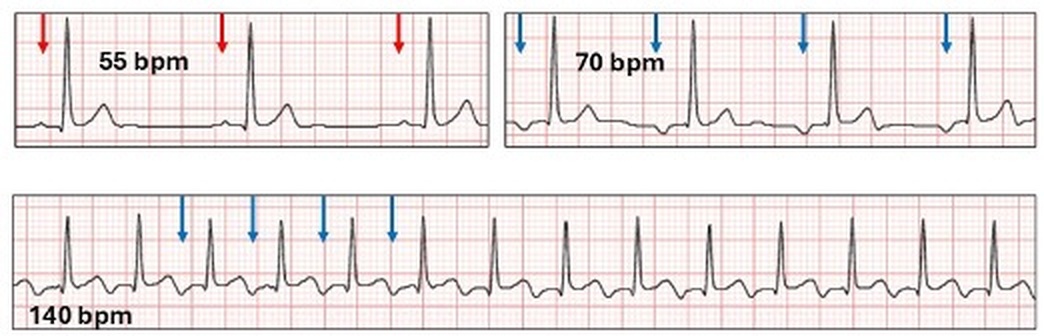
Here is an example of a short PR interval with a nocturnal escape rhythm.
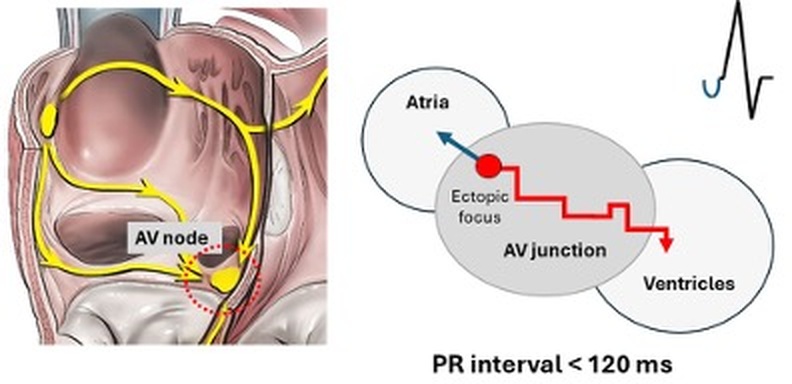
Because the PR interval is very short it is called a junction rhythm.
How do we explain this? There are two scenarios.
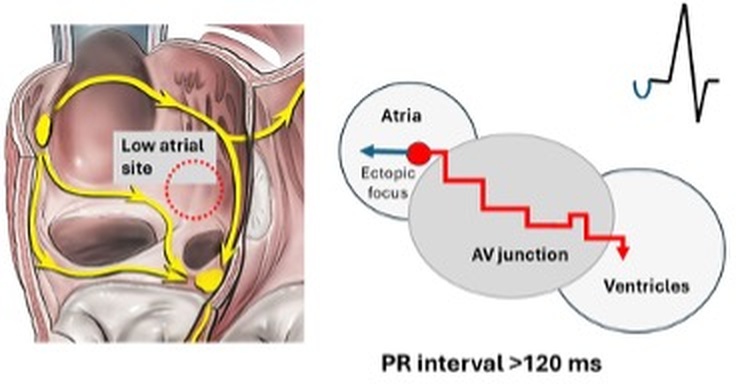
The ectopic focus lies in the low right atrium adjacent to the AV node.
The wave of depolarization emanates from the focus and initially depolarizes the atria retrogade resulting in an inverted P wave (blue arrow). At the same time, the wave enters the AV valve and because of decremental conduction is delayed in its passage to the ventricle (wavy red arrow). The result is a PR interval > 120 ms.
In contrast, the ectopic focus is high in the AV node with a PR interval < 120 ms.
There are however, other patho-physiological reasons for a delay in the PR interval such as AV nodal disease, that will influence these findings.
With our case study the ectopic site is likely to be in the atria as the PR interval is long.
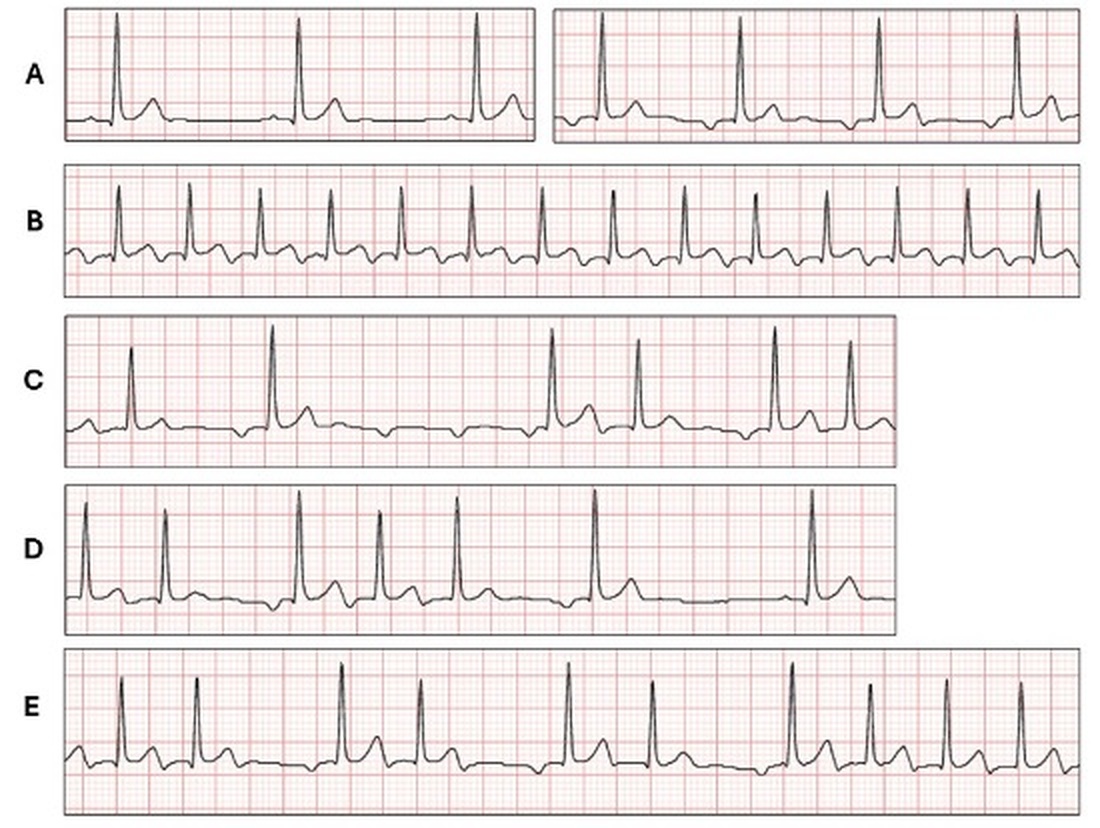
A, B.
The second row shows a run of a tachyarrhythmia (140 bpm) with inverted P waves (blue arrows). This is a run of atrial tachycardia with the P waves clearly demonstrated.
Atrial tachycardia
For practical purposes, an atrial tachycardia has a single ectopic focus within the atria, but outside the sinus node and AV junction. The underlying mechanism is either enhanced automaticity (spontaneous phase 4 depolarization), triggered (ectopics) or re-entry. If automatic, then the term focal atrial tachycardia is applied, although micro-reentry circuits may also be involved. The episodes are usually paroxysmal in the adult but can be sustained (> 30 seconds) or incessant (fun with ECGs 161).
Asymptomatic short runs between 100 and 160 bpm, particularly in the elderly at night are by far the most common tachyarrhythmia seen on ambulatory ECG monitoring. The P wave morphology is usually the same as any accompanying atrial ectopics. Apart from age and heart disease, precipitating factors include alcohol, caffeine, cocaine, digitalis toxicity and increased catecholamines.
In our case study, because there is accompanying runs of ectopic atrial rhythm and a PR interval > 120 ms, the tachyarrhythmia is clearly a focal atrial tachycardia.
Using the 12-lead ECG, there are described methods of identifying where the ectopic focus lies in the atria by the P wave configuration.
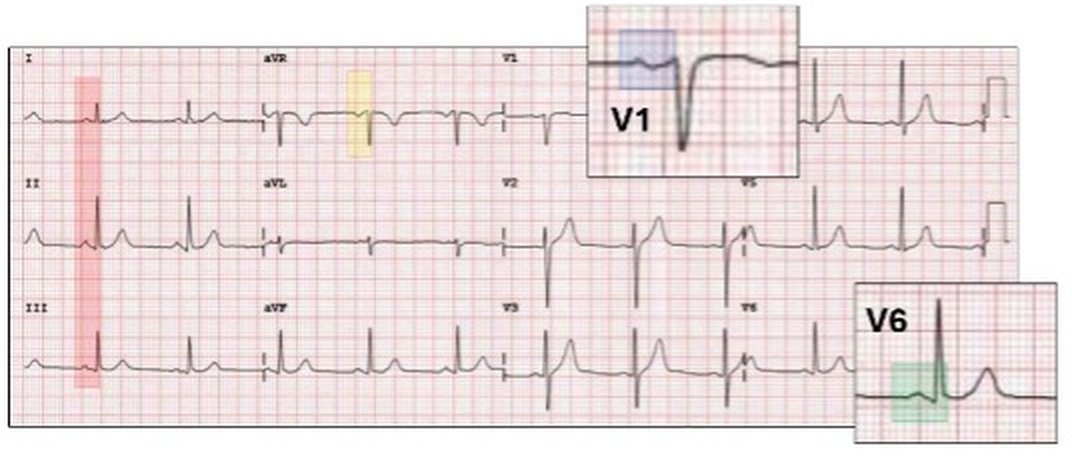
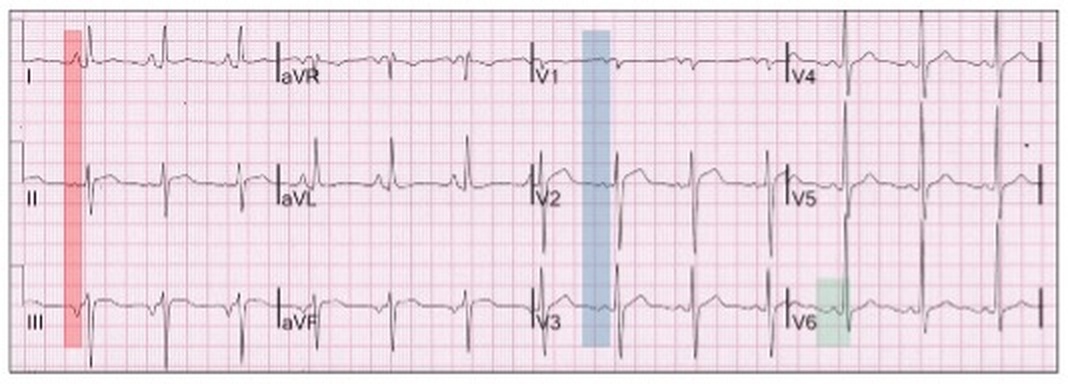
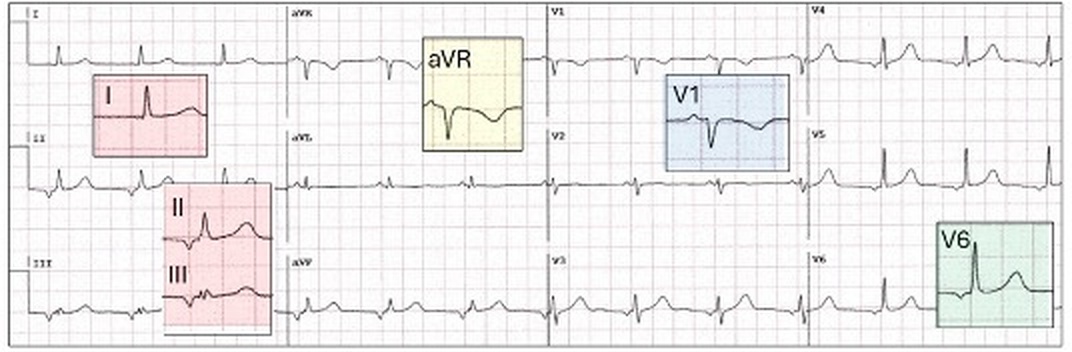
Here is a brief summary of the P wave configurations of three sites.
Sinus rhythm, the P waves are:
Upright in leads I, II and III (red highlight).
Inverted in lead aVR (yellow highlight).
Inverted or sinusoidal (biphasic) in V1 (blue highlight).
Upright in V6 (green highlight).
Low atrial rhythm, the P waves are:
Upright in lead I (red highlight).
Isoelectric or inverted in lead II (red highlight).
Inverted in lead III (red highlight).
Chest leads same as with sinus rhythm (blue and green highlight).
Left atrial rhythm, the P waves are:
Upright in lead I and aVR (red highlight).
Inverted in leads II and III (red highlight).
Upright in lead V1 (blue highlight).
Inverted in V6 (green highlight).
Let us review the next tracing.
C.
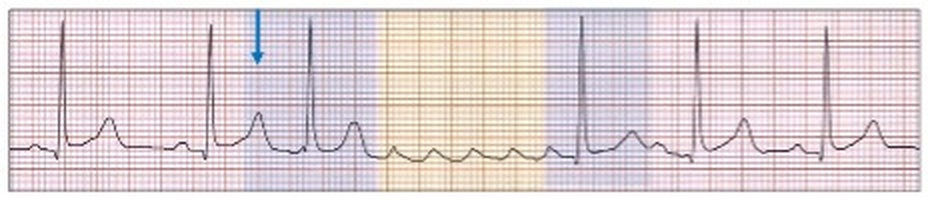
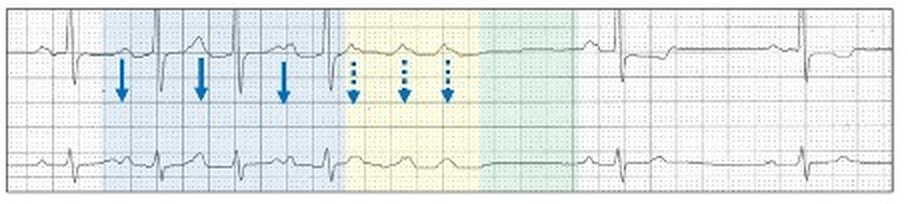
There is a run of three non-conducted ectopic P waves (yellow highlight).
This is a short run of non-conducted focal atrial tachycardia.
Non-conducted focal atrial tachycardia
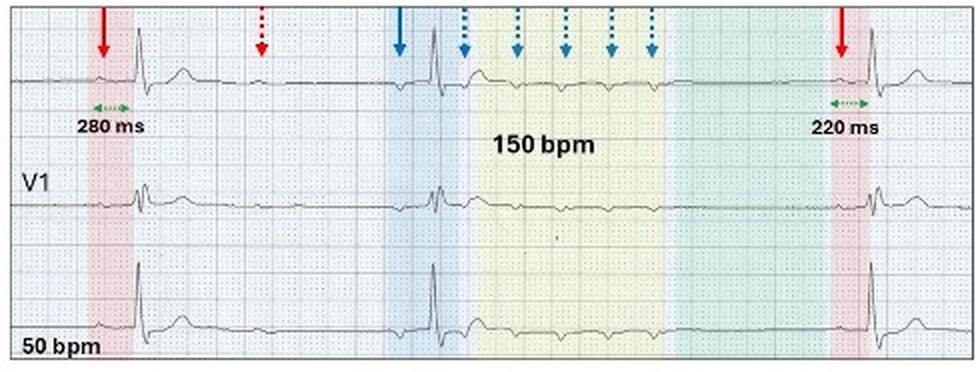
Non-conducted focal atrial tachycardia are short runs of atrial tachycardia with no or limited AV conduction and although rare on the 12-lead ECG, is not uncommon on Holter monitoring. Because of its consistent appearance it is easy to diagnose.
Features include:
Underlying sinus rhythm (red highlight) with a short run of a rapid non-conducted focal atrial tachyarrhythmia (yellow highlight).
The underlying mechanism is probably enhanced automaticity (spontaneous phase 4 depolarization), although micro-reentry circuits may be involved.
Discrete prominent P waves (blue stippled arrows)
First beat may be conducted to the ventricle (blue highlight).
There is an increase in the non-conducted P wave rate with the largest increment reduction between the first and second P waves (green stippled arrows).This is Wenckebach block at the ectopic-atrial interface (section 11.6).
There is a pause after the termination of the tachyarrhythmia (green highlight).
The rate and number of ectopic P waves, the positioning in the sequence of the conducted beat or beats, if present, and the length of the terminal pause varies.
No atrial ectopic
There is a left atrial abnormality and marked first degree AV block.
No pause
The conducted ectopic beats may be junctional or from a different atrial site (blue arrow).
There may be more than one conducted ectopic beat (blue highlight).
Run of both focal conducted and non-conducted atrial tachycardia.
Giving rise to complex rhythms.
Run of focal atrial tachycardia (yellow highlight) with varying conduction (blue highlight). There is a ventricular ectopic (purple arrow).
This would in keeping with our case study; focal atrial tachycardia with non-conducted runs.
Another feature lies in the conducted beats before and after the pause. The PR interval before the ventricular pause is long and after it is short. This represents an atypical Wenckebach AV block.
The presence of Wenckebach AV block within the same tracings as a non-conducted focal atrial tachycardia is not unusual as both are blocks at the AV node.
Sinus rhythm with both evidence of Wenckebach AV block (red highlight) and a run of non-conducted focal atrial tachycardia (yellow highlight).
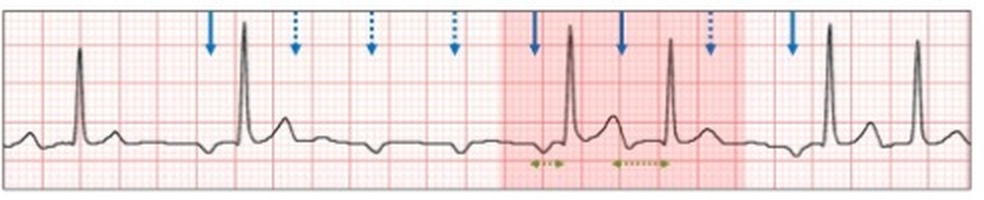
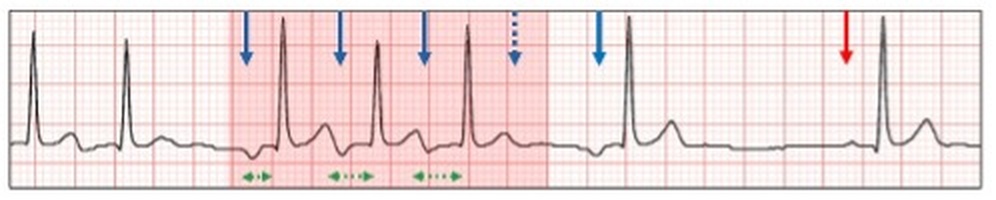
Searching the provided tracings in our case study, there were frequent episodes of Wenckebach AV block within the focal atrial tachycardia.
Here are examples.
C.
Conducted and non-conducted focal atrial tachycardia with 3:2 Wenckebach AV block (red highlight).
D.
Short run of conducted focal atrial tachycardia with 4:3 Wenckebach AV block.
E.
Continuous run of conducted focal atrial tachycardia with 3:2 Wenckebach AV block sequences.