To receive a free PDF copy of The Fundamentals of Electrocardiograph Interpretation by Harry Mond, subscribe to his email blog by entering your email address below.
Thank you! Your submission has been received!
Oops! Something went wrong while submitting the form.
Purchase the textbook
Purchase a hard cover or paperback copy of The Fundamentals of Electrocardiograph Interpretation by Harry Mond on Amazon.
When I receive an ECG with a pacing rhythm, the report invariably states, “ventricular pacing” or “dual chamber pacing” with no attempt to interpret it.
I saw this ECG and decided to use it as an example of how to interpret pacing ECGs.
All the information is there, but to help you I have added rhythm strips.
What do you think? Have a go at reporting what you see. There are no tricks.
We first need to determine the pacing mode as seen on the ECG.
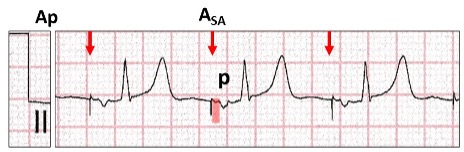
Atrial pacing (Ap). At regular cycle lengths, there is an atrial stimulus artefact (red arrow, ASA)followed by an inverted P wave (P). Note, there is a latency period after the stimulus artefact (red highlight) suggesting a time lapse from delivery of the energy to commencement of atrial depolarization in that lead. For significant latency, there must be some delay in all leads, suggesting severe atrial disease. A narrow QRS follows the P wave confirming normal AV conduction. The programmed pacing program can be AAI or DDD with atrial pacing and ventricular sensing (Ap Vs).
What is the significance of a negative paced P wave in lead II?
Let us the review leads I, II, III for the frontal plain axis.
What are the P waves appearances with different pacing sites in the atrium?
Atrial appendage (red stippled circle). The wave of depolarization is superior to inferior (green arrow).There are positive P waves in leads I, II and III (red highlight).
Triangle of Koch(yellow stippled circle). The wave of depolarization is inferior to superior(red arrow). There is an isoelectric P wave in lead I, and negative in leads II and III (yellow highlight).
The atrial lead is therefore inferior and adjacent or in the triangle of Koch.
The clever ones amongst you also noticed that the dipole of the stimulus artefacts also changed in harmony with the P waves. This occurs with bipolar pacing as the cathode and anode are adjacent to each other. With unipolar pacing, the dipole is large and dependent on the position of anode which is the pulse generator can.
Is there ventricular pacing?
At first glance, ventricular pacing cannot be recognised. However, the QRS changes from a narrow QRS (Vs, red highlight) to a left bundle branch block configuration (Vp, yellow highlight) midway through the tracing, strongly suggesting ventricular pacing. Careful inspection in leads II, V2 and V3 show a small stimulus artefact (blue arrows). Although all leads should be inspected, the most important are those where the dipole embraces the lead tip (right arm to left leg or lead II) and the chest leads closest to the lead tip (V2 to V4).
Here is bipolar ventricular pacing with largest stimulus artefacts in leads II, V2, V4.
Even within the same ECG lead, the size of the stimulus artefact varies from beat to beat. Although this occurs with both atrial and ventricular bipolar pacing, it is far more prominent with atrial pacing and is dependent on respiration.
Atrial (Ap) and ventricular(Vp) bipolar pacing. The size of the stimulus artefact varies in a cyclical manner (red arrows). The size of the artefact that reaches the ECG electrode is dependent on the chest wall impedance which alters with inspiration and expiration.
We have now confirmed ventricular pacing, but where is the lead positioned?
Left bundle branch block configuration confirms right ventricular pacing.
The limb leads have a normal frontal plain axis (red highlight).
The chest leads have tall R waves in V4 to V6 (yellow highlight).
Let us review the 12-lead ECG for pacing from different sites in the right ventricle.
There are four ECG features that must be recognised in order to establish right ventricular lead position.
Confirm ventricular pacing
Bundle branch block configuration
Frontal plain axis in the limb leads
Presence or absence of R waves V4-V6.
For right ventricular apical pacing (red, yellow oval):
Left bundle branch block configuration (red highlight).
Left axis deviation with R wave in lead I and S waves in leads II and III (yellow highlight). The wave of depolarization is from apex towards the left shoulder.
Deep S waves in V4 to V6 (blue highlight).
For right ventricular outflow tract (red, yellow oval):
Left bundle branch block configuration (redhighlight).
Normal axis with R waves in leads I, II and III(yellow highlight). The wave of depolarization is superior to inferior.
Tall R waves in V4 to V6 (blue highlight).
For mid-right ventricular pacing, the frontal plain axis and presence of R waves in V4 to V6 are transitional. Minor positional changes may result in marked ECG changes. In our case study the pacing lead is positioned in the right ventricular outflow tract.
Why the transition on the ECG from ventricular sensing to pacing?
With ventricular sensing, there is an atrial stimulus artefact (red arrow) followed by atrial depolarization and a P wave (red highlight).
With ventricular pacing, there is an atrial stimulus artefact (blue arrow) with no P wave following (yellow highlight). After a delay of >300 ms there is ventricular pacing.
The most likely cause would be high threshold exit block, where the amount of energy delivered to the atrium is insufficient to result in depolarization.
Because of the atrial latency, there is likely to be significant atrial disease as well.
The pacing program is conventional DDD(R) with a very long AV delay. None of the algorithms to minimize ventricular pacing has been programmed ON, as there would have been a failed AV delay prior to activating the algorithm.
Because of failure to depolarize the atrium, search for escape sinus P waves.
Within the second AV delay with failure to atrial pace (yellow highlight, red arrow), there is a late escape P wave (red stippled circle) which conducts to the ventricle at the same time as the ventricle is paced. Because of the timing, the sinus conducted ventricular depolarization has not reached the ventricular cathode and therefore both sinus conduction and ventricular pacing occur simultaneously resulting in a fusion beat (red highlight).
What have we determined?
Bipolar dual chamber pacing, programmed DDD(R)with a very long AV delay.
The indication for pacing was sick sinussyndrome with underlying sinus rhythm (bradycardia).
A ventricular pacing minimization algorithm was not programmed ON.
The atrial lead was positioned inferior, adjacent to or in the triangle of Koch.
The ventricular lead was positioned superior in the right ventricular outflow tract.
As its name implies, AVNRT is a reentrant junctional or supraventricular tachyarrhythmia which involves the fast and slow pathways within the AV node creating a self-perpetuating circus movement. It can be divided into typical (slow-fast) or atypical (fast-slow) as well as several rarer forms related to more than one slow or fast pathway with similar electrophysiological properties. On the ECG, they can be identified and differentiated by the positioning of the P wave in relation to the QRS complex, which in turn is related to the direction of the re-entrant AV nodal circuit. However, in about 60% of cases, the P wave is buried in the QRS/T and cannot be identified on the surface ECG.
Retrograde conduction is defined as conduction from an ectopic site to the atrium via the AV node or accessory pathway and referred to as VA conduction. II results in a P wave configuration which differs from an anterograde P wave, and in most ECG leads is inverted. The site from where the impulse originates can be the AV node, Bundle of His, distal conducting system or the body of the ventricles including ventricular pacing. On the ECG, the QRS complex usually precedes the inverted retrograde P wave but on occasion may follow it.
In 1970, I commenced work as a “novice” cardiologist at The Royal Melbourne Hospital. Training at that time was learning how to recognise the diastolic murmur of mitral stenosis and making sure the ECG and chest x-rays were the correct way up. As this was prior to coronary artery surgery, stenting and echocardiography, the ECG was a highly respected tool for the diagnosis of many conditions. I was fortunate to befriend a number of the gurus of ECG interpretation who taught me to look into the soul of an ECG. Today, even though the ECG is the first investigation performed by a cardiologist, the art of ECG interpretation has been lost because we depend on the new tools for cardiac diagnosis.