To receive a free PDF copy of The Fundamentals of Electrocardiograph Interpretation by Harry Mond, subscribe to his email blog by entering your email address below.
Thank you! Your submission has been received!
Oops! Something went wrong while submitting the form.
Purchase the textbook
Purchase a hard cover or paperback copy of The Fundamentals of Electrocardiograph Interpretation by Harry Mond on Amazon.
This ECG was sent to me by Flynn at Cardioscan, Melbourne.
Thanks Flynn.
What do you think?
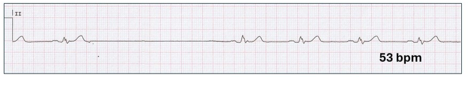
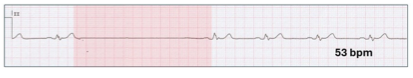
Slow sinus rhythm (53 bpm), borderline first degree AV block (200 ms), a broad QRS (120 ms) and an abnormal broad P wave (140 ms).
Let us revisit the normal P wave.
Usually larger in the arm leads, compared to the chest leads.
Normal sinus P waves are upright in leads I and II, negative in aVR and can be negative or diphasic in leads III and aVL.
In leads V1 and V2, the P waves may be diphasic (sinusoidal) or negative.
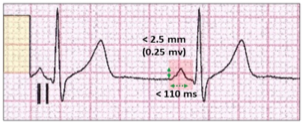
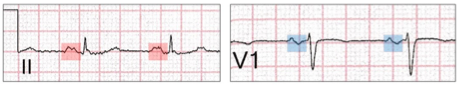
The P wave height (red highlight) should be < 2.5 mm or <25% of the R wave height. This represents 2.5 mm or 2.5 small squares on the ECG.
The P wave width should be < 110 ms.
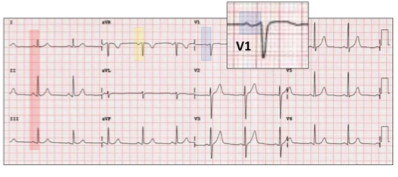
The normal sinus P wave appearance on the 12-lead ECG.
In most leads, the P waves are upright (red highlight).
In aVR, it is negative (yellow highlight) and diphasic in V1 (blue highlight).
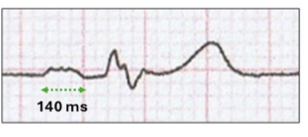
The broad P wave in our illustration is > 110 ms (140 ms) and has a “M” configuration. This is a left atrial abnormality or P mitrale with the P wave duration > 120 ms. It is frequently seen with mitral stenosis and hence the name. The broad sinus P wave represents a delay in left atrial conduction and depolarization, resultant from left atrial enlargement and fibrosis.
The broad bifid P wave is best seen in lead II (red highlight), but sinusoidal in V1. (blue highlight).
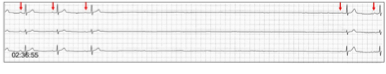
In our illustration there is also a marked pause with no sinus activity, nor an escape QRS (red highlight).
This is sino-atrial block, and the the type can be determined by reviewing the P-P timings.
Sino-atrial block.
Sino-atrial block is part of the spectrum of sinus node dysfunction resultant from the pacemaker initiating action potential being blocked from exiting the sinus node on its propagating journey to the atria.
To understand sino-atrial block, there are a number of principles:
A sinus impulse is recognised on the ECG as a P wave once it leaves the sinus node and depolarizes the atrium.
This results in a regular rhythm with a normal P wave axis.
Delay or block within the sinus node is not seen on the ECG.
As with AV nodal block, there are three levels, reflecting different degrees of sinus node degenerative disease.
First degree sino-atrial block:
Delay at the sino-atrial junction. No surface ECG characteristics.
Second degree sino-atrial block:
Type 1 - sino-atrial Wenckebach.
Type 2 - delay of one, two or three P waves.
Third degree sino-atrial block:
Sinus arrest.
The distinction between the two types of second degree and even third degree sino-atrial block can be subtle, and most reporters don’t bother to try and discriminate.
Sino-atrial Wenckebach.
The is one of the most difficult ECG concepts to understand. I prefer to use the term “Wenckebach” to “type I” in order to prevent aural and written confusion with type II. One of the footprints critical to understanding Wenckebach block sequences outside AV conduction is shortening of the R-R interval during a typical Wenckebach AV sequence.
Let us revisit this footprint.
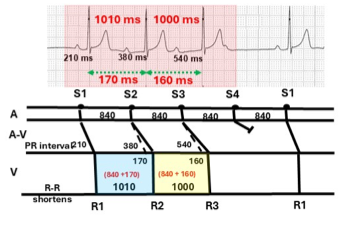
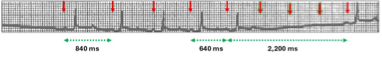
3:2 Wenckebach AV sequence (red highlight) with ladder diagram.
The PR interval increases from 210 ms to 380 ms (S1-S2) or an increment of 170 ms. The next increment (S2-S3) is 160 ms, whereas the P-P interval remains the same at 840 ms. As a result, the R-R interval shortens from 1010 to 1000 ms. On the ladder diagram, the R-R interval (R1-R2) is the sum of S1-S2 plus PR increment (840 + 170 ms = 1010 ms)(blue highlight). For S2-S3, the R-R interval shortens to 1000 ms (yellow highlight).
To summarize:
With Wenckebach AV sequences, the R-R cycle length before the dropped beat is shorter than the one preceding it.
Conduction, however, within the sinus node is electrically silent and similar concealed shortening occurs, but this time seen with the P-P interval. Therefore, to diagnose sino-atrial Wenckebach block, P-P shortening must be identified before the sinus pause.
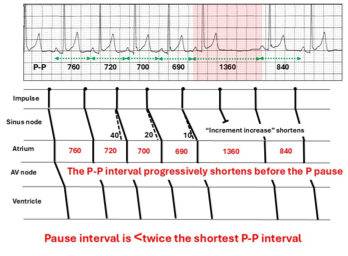
The ladder diagram for a sino-atrial Wenckebach sequence:
For sino-atrial Wenckebach there is:
Progressive fatigue of sino-atrial conduction culminating in sinus block to the atrium and a pause (red highlight).
The sinus node rests, and conduction returns.
The incremental increase in sino-atrial conduction shortens with each beat.
Consequently, the P-P interval progressively shortens with each beat.
Because the P-P interval continues to shorten, the pause interval is shorter (1360 ms) than twice the last P-P interval (700 ms) of the sequence.
For eyeball recognition of sino-atrial Wenckebach:
P-P shortening during the sequence.
Pause without a P wave.
The length of the pause is shorter than twice the last P-P interval.
The first P-P interval after the pause is the longest.
Here is the first ECG description of sino-atrial Wenckebach by Leo Schamroth in 1966. I heard him lecture on this topic in 1972 and of course couldn’t understand it.
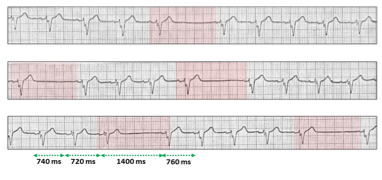
An example of frequent sino-atrial Wenckebach.
P-P intervals shorten before the pause (1400 ms), which is shorter than twice the last P-P interval (720 ms). First P-P interval after the pause is the longest (760 ms).
As with Wenckebach AV block, there may be one or two absent P waves.
Sino-atrial Wenckebach is relatively innocent in asymptomatic patients unless combined with other ECG features of sick sinus syndrome.
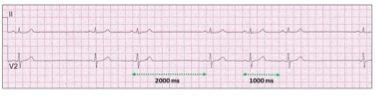
Type II sino-atrial block
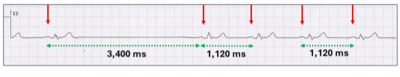
Type II sino-atrial block differs from sino-atrial Wenckebach in that there are no sequences, but rather absent beats with pauses in multiples of the R-R intervals.
Sinus rhythm with P-P interval of 1000 ms (60 bpm) and pauses of 2000 ms.
The cycle length of the pauses are also dependent on respiratory sinus arrhythmia as well as atrial volume and pressure sensors which may vary the sinus cycle.
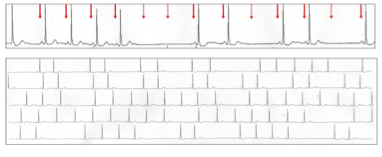
Third degree sino-atrial block.
Simply sinus arrest.
Sinus rhythm (red arrows) with abrupt sinus arrest for almost 11 seconds.
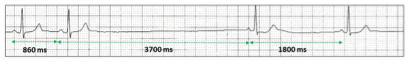
Where type II sino-atrial block finishes and third degree sino-atrial block commences can be confusing.
An example that typifies this conundrum.
Two sinus pauses with neither exact multiples of the base P-P interval of 860 ms. However, they are close, and sinus arrhythmia could explain the differences. Because of the length of the major pause, this would probably be called sinus arrest.
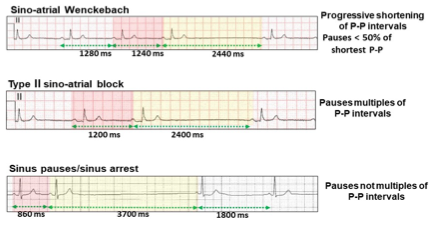
Summary of the ECG features of second and third degree sino-atrial block:
Let us now review the timings on our illustration.
The P-P intervals following the pause are all the same with no P-P shortening. The pause is an exact multiple of the P-P intervals and thus the tracing is:
Type II, second degree, 3:1, sino-atrial block.
Although we see only 5 complexes, there is an enormous amount of information suggesting significant cardiac disease.
The slow sinus rhythm at rest suggests sinus node disease.
The sino-atrial block confirms advanced sinus node disease.
The left atrial abnormality confirms degenerative left atrial disease.
There is borderline AV nodal disease with the PR interval 120 ms.
Ventricular disease is also likely, because of the bundle branch block.
No tricks. Just a selection of tracings from a Holter study.Look at each one carefully, use calipers, arrows and highlight and write down your conclusions.